

I’ll let you into a little secret. When I made my 1st investment I gulped and said to myself, ‘What are you doing? You know nothing about stock market trading’. What I didn’t realise though was that I wasn’t trading, I was investing and there’s big difference between the two. Years later I came to the conclusion that although I didn’t want to be a trader, having knowledge of what they do and how they affect share prices would be useful knowledge to have so I spent some money on courses and devoured Youtube. In this blog I’m going to explain the crazy world of Stock Market Trading and how it affects share prices: Enter Tracy Trader.
Stock Market Trading vs Investing: What’s the difference?
A good place to start would be to answer this question because they are two very different activities. Stock Market Investing is the activity of buying shares in good quality companies at attractive prices, waiting for the company to increase in value and then selling the shares for a profit. Stock Market Trading is the process of anticipating which way a share price will go in a specific time period based on graphical analysis of share price charts and making money whether it is going up or down. Let’s jump into the world of Tracy Trader and see how they do this.
Types of Trader- Day and Swing
First of all, though, let’s understand the difference between a day trader and a swing trader. Basically, they do the same thing, it’s the time difference in which they operate that differs. A day trader, as the name suggests, starts the day with no shares and ends the day with no shares. They buy and sell all day long and cash out by the end of the day. Swing traders hold shares for a longer period, say two weeks to a month but just like day traders, they start the trading period with cash only and end the trading period with cash only.
Stock Market Trading: A day in the life of Tracy Trader
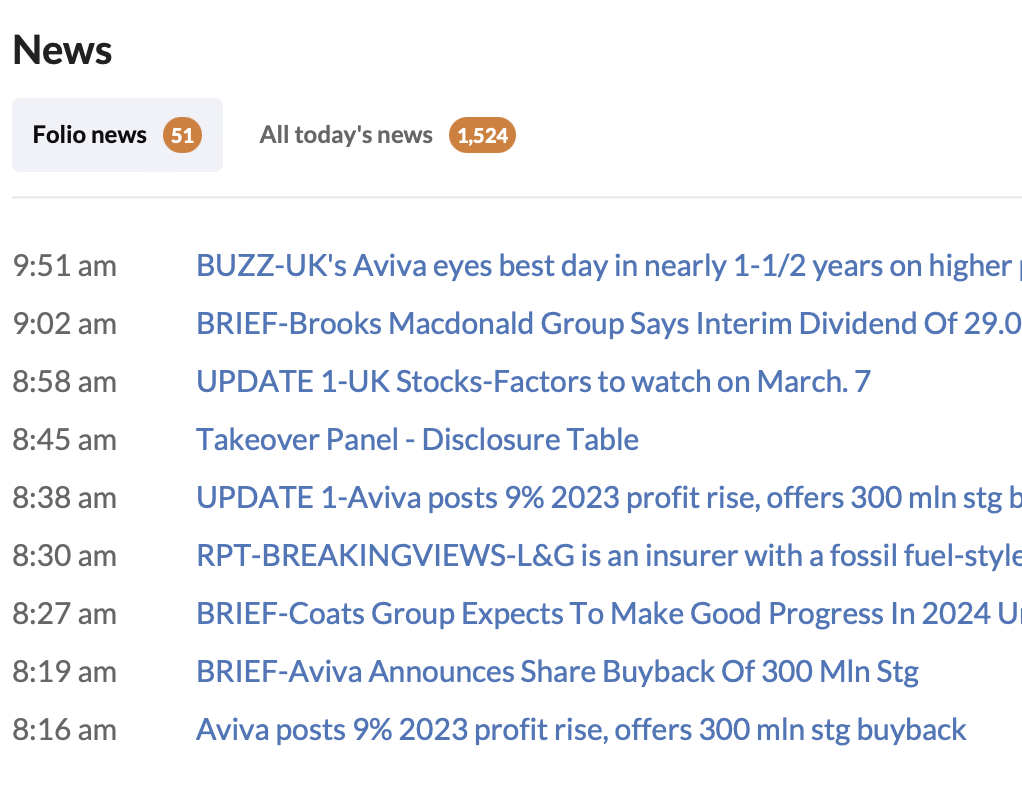
Traders are up, booted and suited and sat at their terminals waiting the the days daily news, the RNS. RNS news arrives on their screens 1 hour before the bell goes in order for them to assess if any company has posted anything that would bring it ‘INTO PLAY’. What this means is that they have posted something juicy that will affect the share price. On the right we can see that Aviva have offered some information about rising profits and a buyback scheme. If this is deemed to be good news the share price will rise but if anticipated profits were supposed to be around 12% this would have a negative affect on the share price which will send it down. Aviva, today, is ‘IN PLAY’.
Japanese candlesticks
Back in the 18th century, somebody invented a way to predict the market sentiment of the future price of rice and therefore which way the price is going to go; It’s called a candlestick, and you can draw a candlestick for any time period. One minute, one hour, one day etc.. If you string candlesticks together they present a chart of which way the price has been moving over a certain period. Each candlestick has a different shape and each has a unique name.
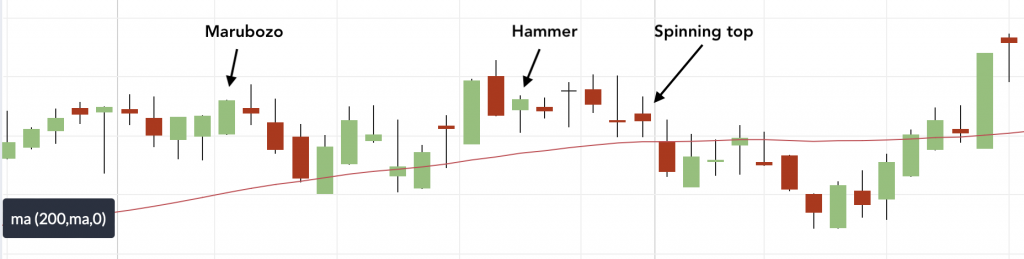
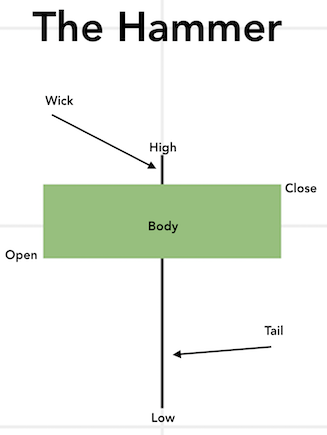
Let’s assume that each candlestick represent’s a time period of 10 minutes and this chart is for a whole day. In every time period there are buyers and sellers (and they can be the same person). A green candlestick means that buyers have pushed up the price and a red candlestick has pushed the price down. Let’s have a look at the hammer in a bit more detail and what it’s telling the trader.
Now in this 10 minute period, the share price of AVIVA started in the open position and ended in the close position but during that period sellers pushed the price right down to the low position and buyers pushed the price up to the high position.
Traders use candlesticks like this to anticipate whether the share price is LIKELY to go up or down in the next ten minute period. A single Candlestick on its’ own isn’t of much use but when you add candlesticks together certain recurring patterns emerge that give the trader an IDEA of where the price MIGHT go next.
Let’s now have a look at two such patterns, The Bullish engulfing and the Tweezer top.
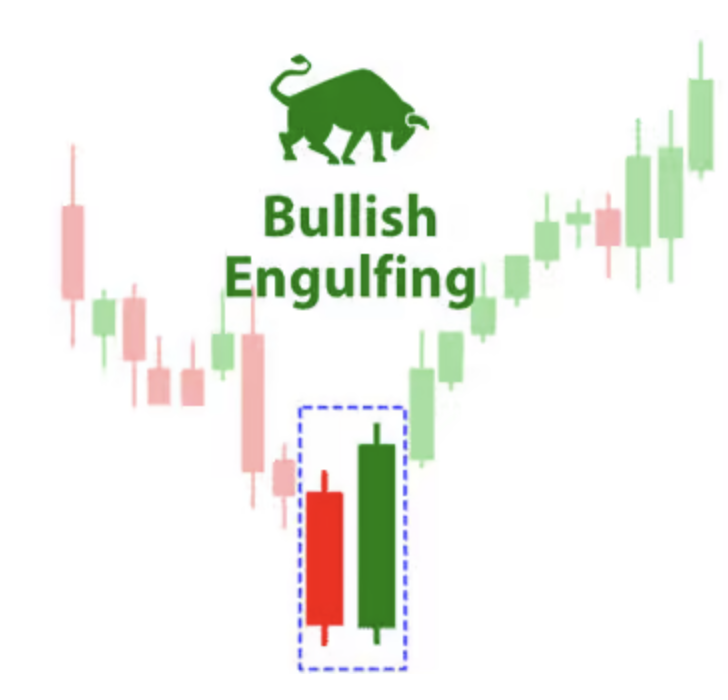
The Bullish engulfing Pattern
As you can see hear the price has been dropping but these two candlesticks mark the end of a downtrend as the green candlestick ‘ENGULFS’ the red one ( in size) signalling that an upward trend MIGHT be about to happen. Of course the opposite can occur in which case it would be a bearish engulfing pattern signalling that a down swing MIGHT be about to happen.
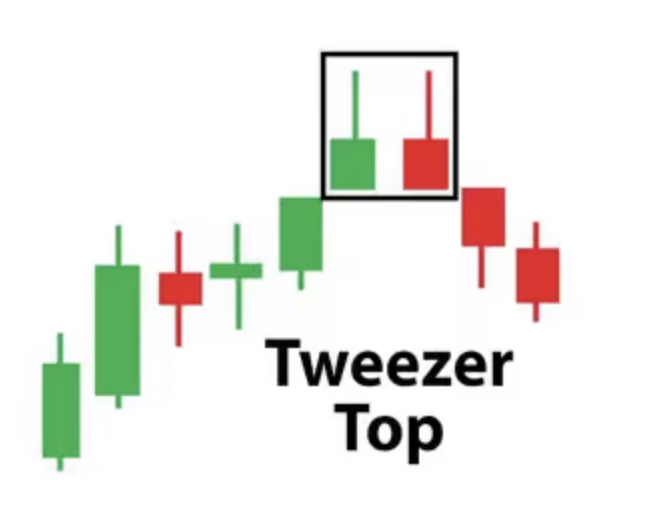
The Tweezer Top Pattern
This one is a bearish (or negative) pattern to look out for. It represent a trend reversal and traders get ready to sell having made money on the up trend.
Shorting Stocks
Now, Tracy can make money when the price is going up, naturally, but she can also make money when the price is going down. If you have a full service account with your broker (known as a margin account) you can borrow shares off them for a small fee, of course and for a set time period. Tracy has spotted a Tweezer top and guesses that the price is going down. She borrows 10,000 shares from the broker at say £1.50 and sells them immediately. She waits for the trend reversal and buys them back at £1.00 a share, thereby making 50P a share which incidentally on 10,000 share is a cool £5K.
The problem with shorting stocks is that if the share price goes up and not down Tracy has to buy those shares at a higher price once the time period is up because she only borrowed them from the broker. The conundrum Tracy now faces is does she buy those shares back instantly and cut her losses or does she hang on and see if it falls again thereby putting herself back in profit. If you put 10K into a company and it goes bust you lose £10K but if you short £10K in shares in a company and the share price keeps rising you could end up losing much much more than your £10K investment. Shorting stocks is a high stakes game.
The Life of a Trader
Every day Tracy is playing the game. The most amazing discovery I made about trading is that they are not interested in the company itself. They’re not bothered if the company is making profit, what they make, if they are environmentally conscious, if they look after their customers or staff or anything for that matter. All they focus on is the price and the direction of momentum in a specific time period. All they are doing is playing a game of poker against each other. The Company itself just opens its doors to trade and yet its’ share price goes up and down like a yoyo.
Conclusion
Taking these trading courses was important for me to understand what they do, how they do it, how they affect short term share prices and most importantly why ‘I WILL NEVER EVER GET INVOLVED IN STOCK MARKET TRADING‘. Warren Buffett has never done it, Peter Lynch hasn’t either and they have made billions by just investing in good quality companies. In my next blog I’m going to explain 5 reasons why share prices go down and how as investors we can make profit as a result.
0 Comments