Research is an integral part of stock market investing. Without it you would be blindly making investments in companies that you know nothing about. Not so long ago this meant spending many hours in libraries going over reams and reams of financial reports, almanacs and newspaper articles. Those days are over. The internet has brought stock market research right to your breakfast table and the website I use is called Stockopedia.
Before we begin I would like to say that Stockopedia is not the only research website available but it’s the one I use and by the end of this blog you’ll understand why.
Your path to stock market investing success
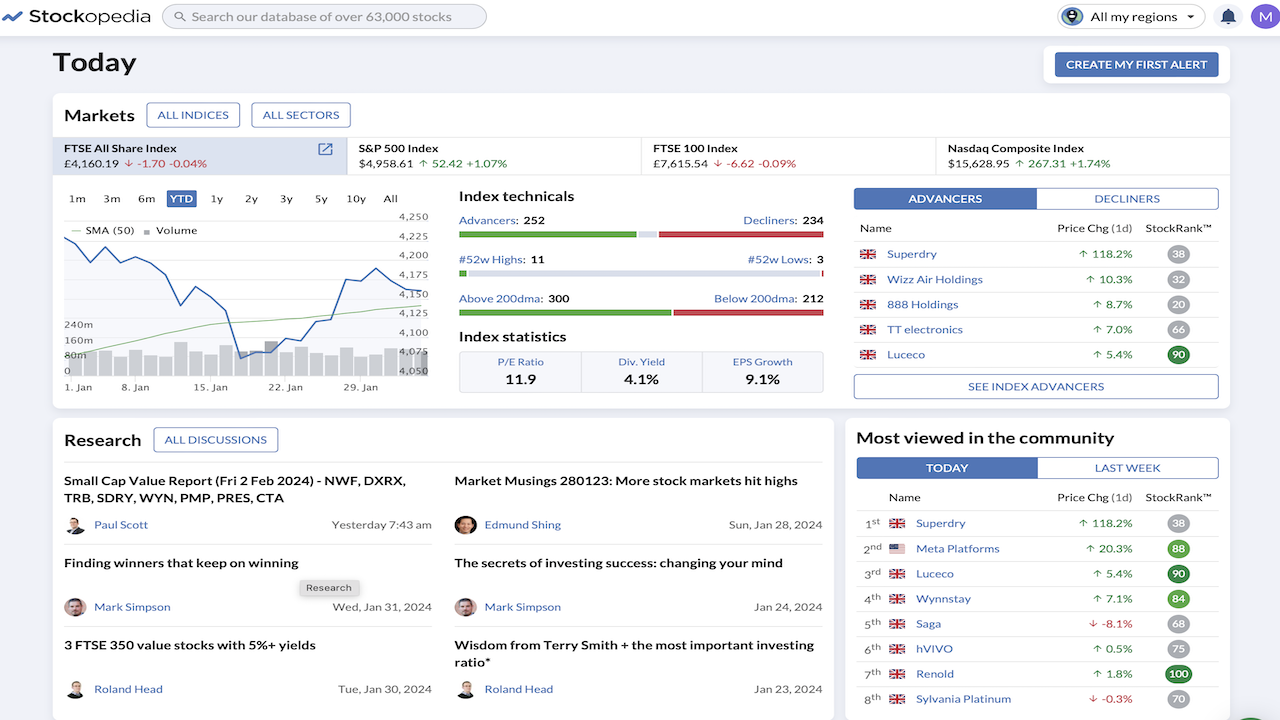
Investing in the stock market is a very simple process. RESEARCH-WATCHLIST-INVEST. That’s it. In this blog we’ll go through what Stockopedia has to offer in terms of being a research utility and how it can help with your stock picking and portfolio management. It’s an extremely comprehensive research tool and looks quite daunting but if we break it down into bitesized chunks it is easy to navigate to the areas that we want to concentrate on. Here’s the top half of the home page.
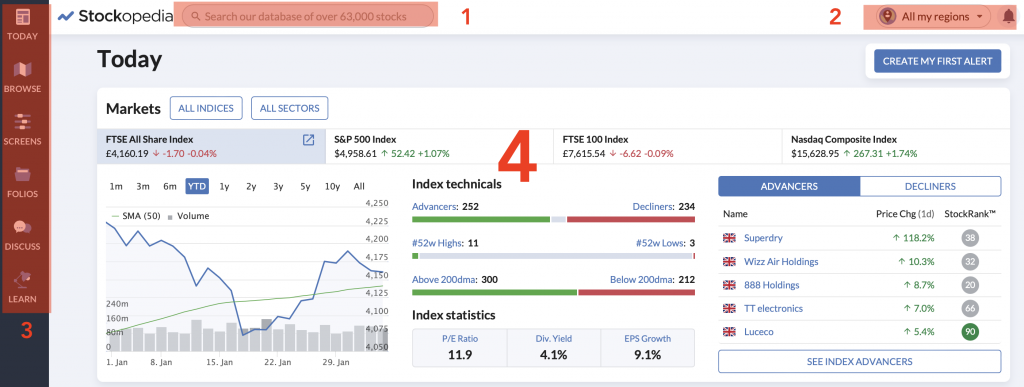
At point no 1 we can type in any company we want to investigate and go straight to its info page. The drop down menu at point 2 allows you to select whatever geographical region you are interested in. On the left side (point 3), you can create screens, browse articles, manage you portfolio and there’s a whole section of learning videos and written material for you to look through and at point 4 there’s a comprehensive section of general information, market conditions, statistics, Index performances etc..
All I’m interested in here is typing in the company I want to investigate and going straight to the individual data sheet. I’m also interested in the screen button of the left as this allows me to create a filter that narrows down my search list. That’s it.
Let’s look at the next part of the home page. Everybody has an opinion either way on the right strategy, best companies, global economic conditions and you can read all about their opinions here. And on the right side is a list of the most viewed companies. Nothing for me here to get excited about so I ignore this section

Section 3 displays what is know as the RNS, the Regulatory News Service. In my blog ‘A brief history of the stock market‘, I mentioned that the Stock Market was introduced to protect investors from unscrupulous business people running off with our money and it does so by introducing rules and regulations that companies have to follow before they can apply for public money and one of those rules is to inform investors of that affects the prospects of the company so we can make decisions accordingly. Information such as contracts won, directors leaving, directors buying shares in their own company, selling of sections of the company etc.. and this is done from 7 A.M each day via the RNS.

The RNS starts at 7AM because it gives traders and investors one hour before the stock exchange opens for business to digest the news. Generally speaking if it’s good news the share price goes up, if it’s not such good news the share price goes down.
I don’t pay attention to anything else on the home page except the RNS.
The Stockopedia data sheet
As I’ve already profiled Rolls Royce I might as well use them as the example. The data sheet is quite comprehensive so I’ve broken it down into three sections. Here’s section 1. Anything I don’t describe will be dealt with in Stockopedia (part2) so for now let’s just get used to what information is being offered.
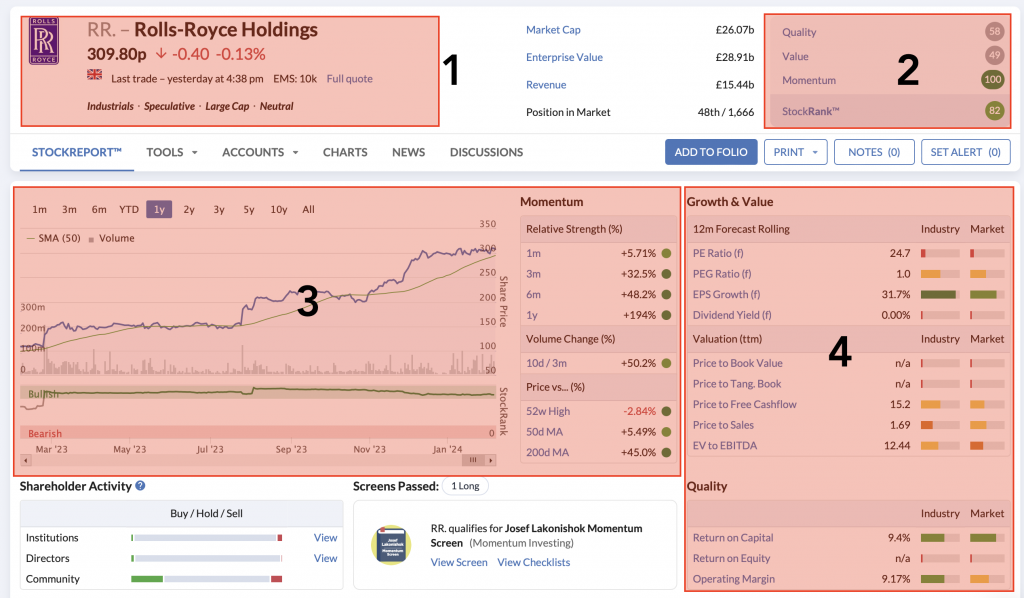
Box 1
Here is some basic info about the company. Its name, current share price and daily movement. Nothing too fancy.
Box 2
Stockopedia has kindly given every company a number from 1 ( really bad) to 100 ( really good) based on three criteria- Quality-Value-Momentum. These are the main three criteria everyone uses to assess companies.
- Quality – Is the company making profits, efficient with it’s capital, controlling debt levels etc
- Value – Is the company’s share price cheap relative to it’s overall value
- Momentum – are the shares currently being bought or sold
Box 3
A nice little graph showing 1 years share price. You can change the graph to show you ranges from 1 month to 5 yrs. As we can see he share price has been rising steadily which is confirmed by the momentum figures to the right and the Momentum figure of 100 in box 2.
Box 4
Here we have the information relating to the Value and quality metrics that make up the Stockopedia stock rank number.
Stockopedia Data Sheet – Section two
I have some bad news for you. In order to use the information in this section you WILL need to have a degree in applied maths and be a fully qualified accountant. ABSOLUTE NONSENSE. Let’s take a look.
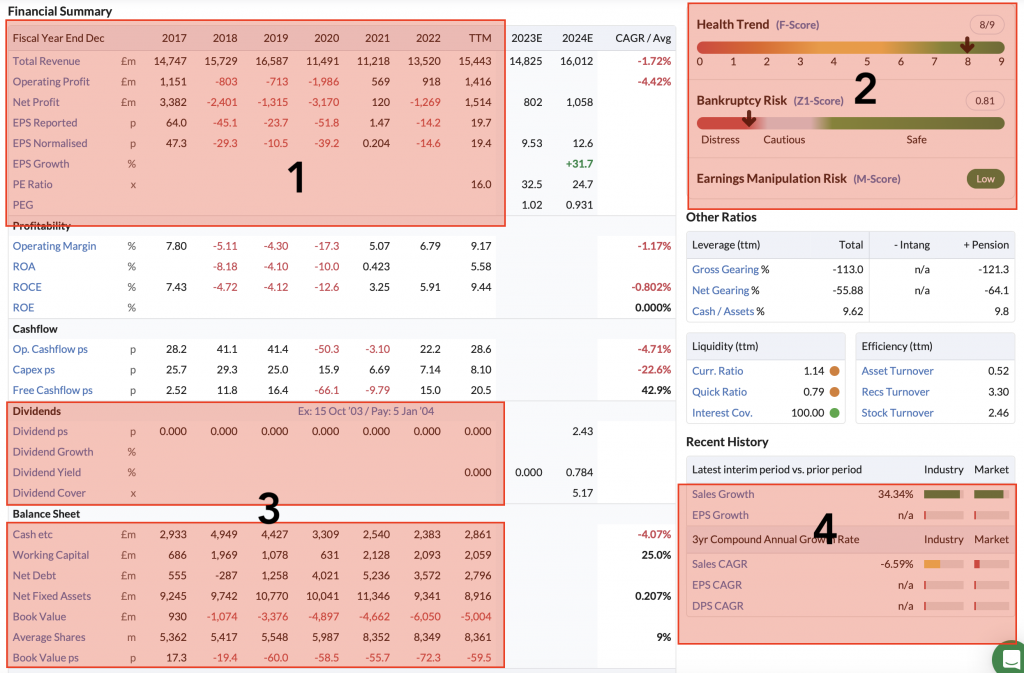
Box 1
Here we have a brief summary of the financials of the company both this year and historical years. If Total Revenue and Net Profits are going up year on year so will the share price. Easy to see that RR revenue has been increasing over the last three years and has returned to profit this year.
Box 2
Let me introduce you to Mr Piotroski. He invented the F-score: a set of 9 questions to determine the health of the company. Questions such as;
- Is the company making profit
- Is the company making more profit than it did last year
- Is the company controlling it’s debt
- Is it more productive than it was last year
These questions are no more difficult than ‘Can I afford to buy that car or can I afford to go on holiday’?
Also in this section is the Z-score, the likelihood of the company going bust based on a set of criteria. Seeing as the share price has been rising consistently over the last year I’m not to sure anyone is paying too much attention here.
Box 3
If you like the idea of receiving annual dividends you can find the information here. Rolls Royce don’t offer dividends so you wouldn’t buy RR if that’s what you’re interested in. The balance sheet section gives you information such as how much cash the company has and what are its debt levels and you can compare the current year to previous years. What is the trend? Is cash going up or down? Are debt levels being managed properly.
Box 4
What’s been going on in the last 3 years? As we can see sales have been growing at a rate of 34%. I hope you’ve also noticed the traffic light colours next to the numbers. This compares the company to the industry and overall market averages giving you at a glance an insight into how the company is doing. How good is that? These aren’t difficult questions to ask.
Stockopedia data sheet- Section 3
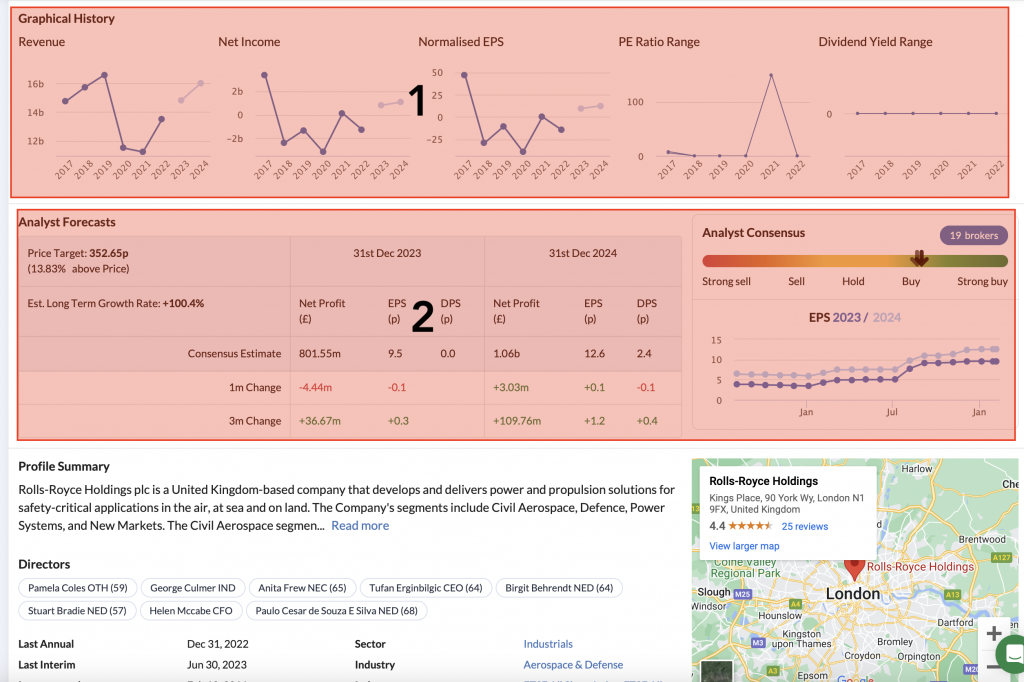
In the last section Stockopedia provides details analysts forecasts and a graphical representation of the numbers being produced by the company in addition to a summary of what the company does and where its head office is. Why is this information here? No idea, just for completeness I suppose.
Stockopedia Data Sheet – Conclusion
Everything I need (and more) for me to assess where the company has been and where it is now is detailed on this one single data sheet. In addition to the financial information Stockopedia have provided a ranking system based on quality, value and momentum, a traffic light system so I can compare the company against it’s rivals and the market as a whole, a health trend value and a bankruptcy score to aid me in my decision. But that’s not all. In my next blog Stockopedia – The ultimate stock market research tool (part 2) I will show you how you can build screens to filter out companies that don’t fit your criteria, build a portfolio tracking system so you don’t deviate from your required goals and more but for now don’t be over-awed by Stockopedia. Just break down all the information into bite sized chucks and it becomes such a powerful tool and I for one wouldn’t be without it. Click here to go to the home page.

Absolutely love this piece of kit, pays for itself many times a month. Only (slight) criticism is it’s reactive in nature but with bit of extra effort you can really bring out its predictive side …… so invaluable