

In Part 1 I went through all the information that is displayed on the Stockopedia home page and then took a look at the detailed data page for Rolls Royce. I highlighted some of the information blocks available such as the stock rank, health trend and financials sections and suggested that by breaking the data page down into bitesize chunks we can use the information to form a more detailed opinion on our investing choices. In this blog I’m going to delve deeper into how else Stockopedia can help us become better investors.
The Stock Screen

Search our database of over 63000 stocks? No thanks. It’s very nice of Stockopedia to allow me access to over 63000 data sheets of companies all over the world but if I did that I would be 263 years old by the time I got through all of them so there has to be a faster way to do the research. Right? Funny you should ask. Yes there is, you create a stock screen. A stock screen is a filter that allows you to add rules to exclude companies from your search that you are not interested in. For instance let’s say you like the dividend strategy and you want to look for good quality companies that pay a dividend over 6%, has enough money to keep paying the dividend, are based in the UK and have a health trend value equal to or greater than 4. Here’s the stock screen I have created based on those criteria.
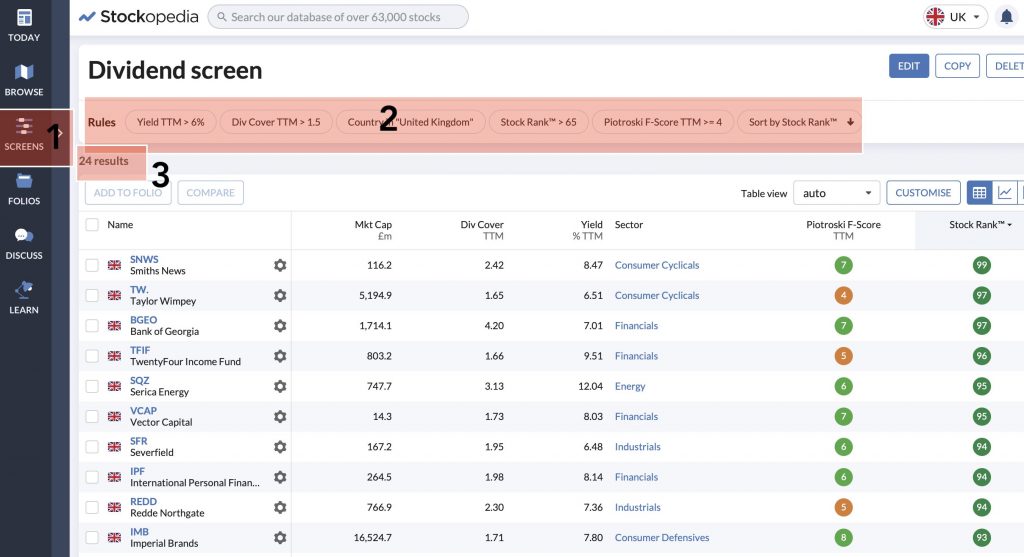
On the left hand side at point 1 you will find the screen icon. Creating a new screen means you can now add rules based on your desired criteria which is what you can see at point 2. From left to right we wanted companies that offer a dividend 6% or over. This is the yield rule. The second rule, Div cover is the amount of cash available to keep paying the dividend. A general rule of thumb here is a div cover of 1.5 or over. Rule no3 adds companies only listed in the UK. The Stock rank is the quality of the company. We don’t want to look at any companies below a stock rank of 65 and the F-score is the health trend of the company. I have set this at 4 so I don’t want to look at any companies that are unhealthy. As you can see at point 3 we have reduced a database of 63000 companies down to a much more manageable size of 24. I can now click on any company listed below and this will take me directly to the company data sheet and from there I can do my research. Editing my rules and being a bit more stringent like changing the stock rank to over 80 and the F-score to over 6 will reduce the list even more but be careful here. The more stringent the rules the more chance of a golden nugget lurking just outside the parameters. It’s a bit like looking for a house on right move. You type in your budget of £300K but there might be the perfect house for you listed at £350K that may be willing to accept an offer of £300K. It won’t come up however because your search criteria was a bit too tight. I like to loosen my criteria but that’a just my personal choice. To me, a good quality Stock Screen is an essential tool for investing because it makes life so much easier.
The Portfolio Management system
So you’ve decided on an investment strategy, You’ve used the Stockopedia stock screen to do some research and you’ve purchased a few companies. GREAT. How do you keep tabs on what you’ve bought and how they are doing. You create a folio. Here’s my ISA portfolio.
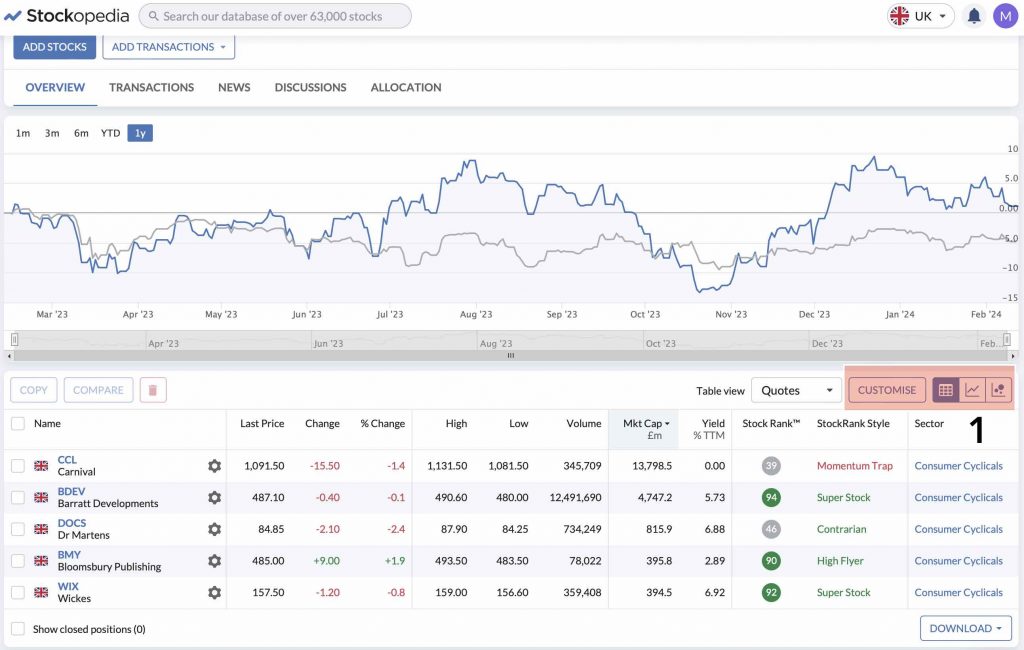
By default your portfolio is presented in list form. The graph represents the performance of your of your portfolio against the FTSE All-share index (the average of all the shares listed on the UK stock exchange)
The customise section ( point 1) allows you to present your portfolio in different graphical formats. I particularly like the bubble chart.
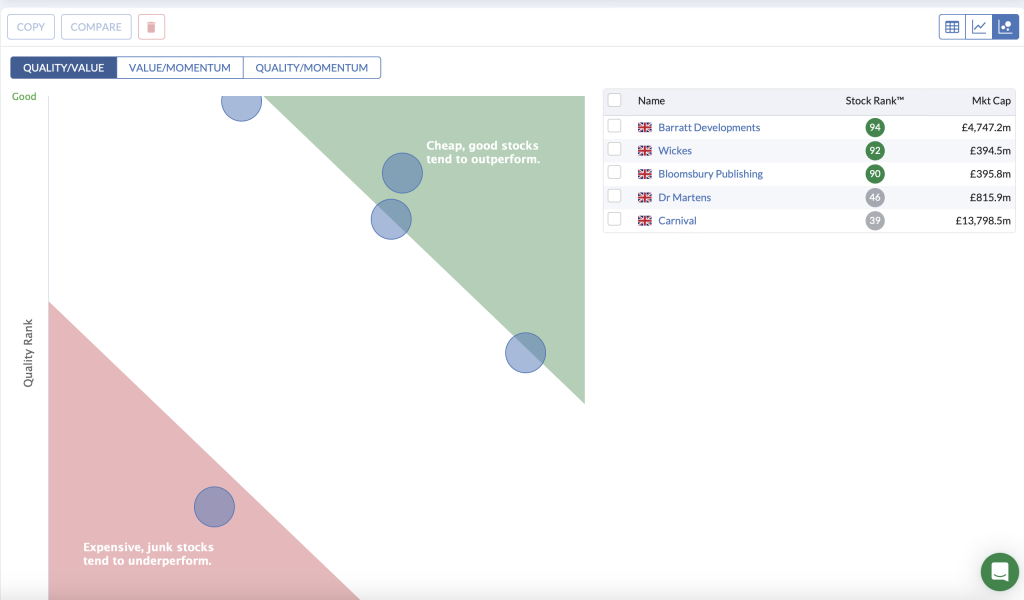
Your portfolio will be a constantly moving entity. You’ll buy and sell companies down the years. The bubble chart will advise you of your investing decisions and let you know if you are exposing your portfolio to too much risk. The more companies you have in the red, the more chance of becoming a millionaire or losing your shirt. The more companies you have in the green the more boring the companies are but the more stable are your returns. It’s up to you to blend your portfolio based on how much risk you are happy to take.
The third customisation you can do is to display your portfolio in line graphs.
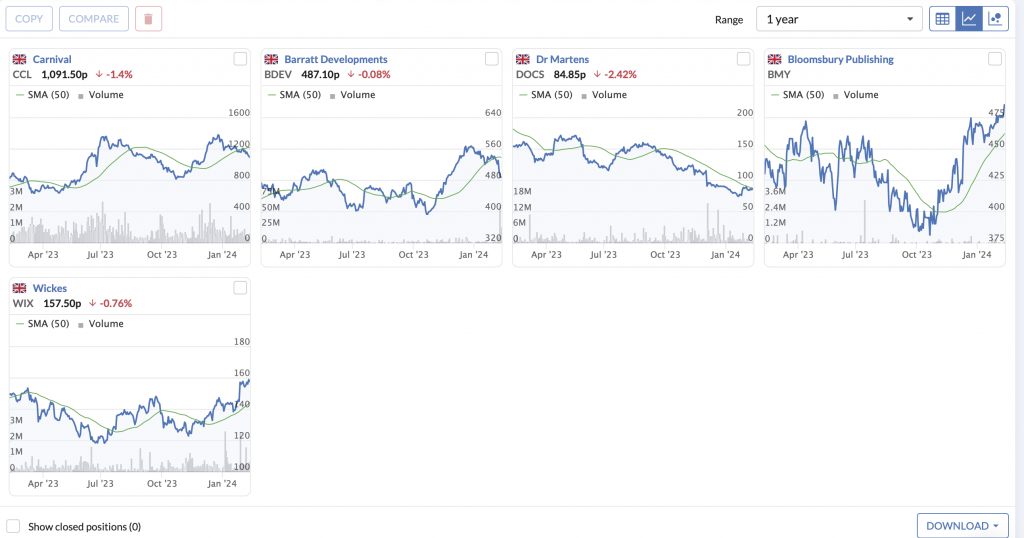
In this format, you can identify in which direction your investments are going. If this was your portfolio you may decide to sell Wickes and buy more Bloomsbury for instance. Where else can you see the graphs of all your investments displayed on one single page? Great useful management information displayed differently.
The Stockopedia Print utility
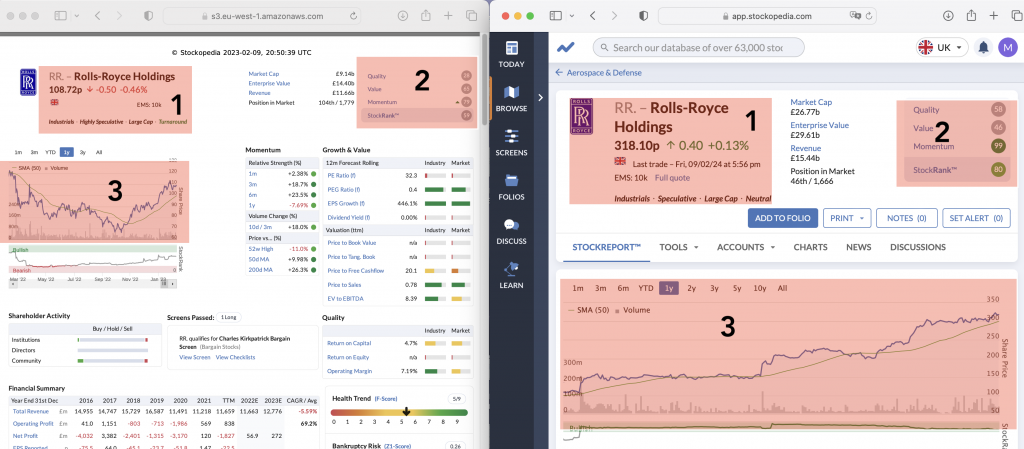
The third section of this blog is the print function. Personally I don’t like the title because it doesn’t represent what it does ( in my opinion anyway) so let’s take a look at what it offers. Back to Rolls Royce.
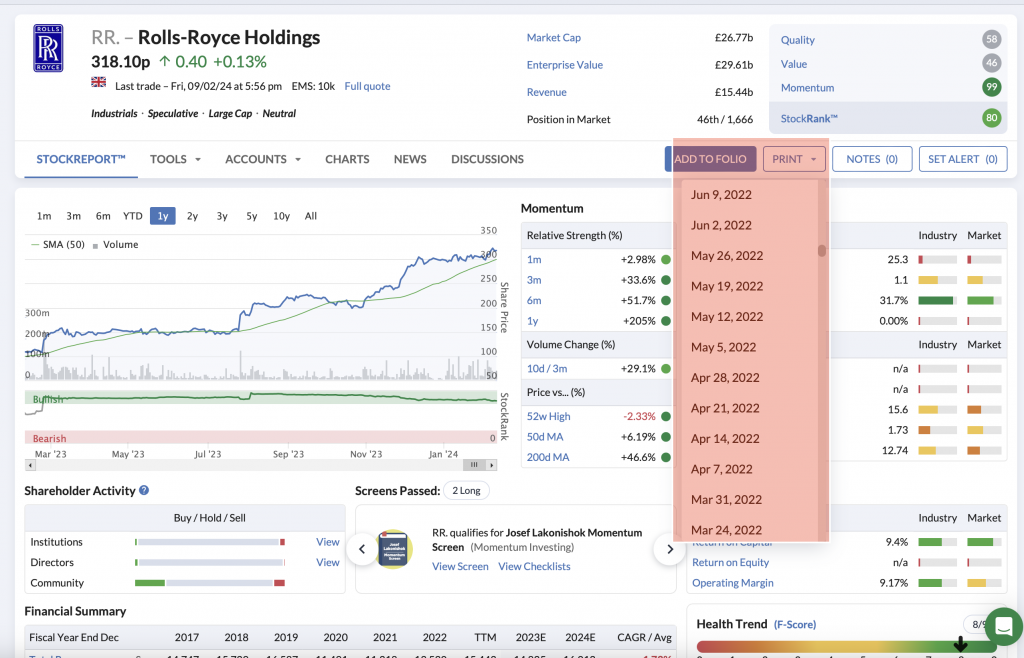
When you click on the print button you are presented with a list of dates. These dates ( when you click on any one) will bring up the data sheet in PDF format for that date. So, for instance, if you bought shares in a certain company 12 months before and the investment hasn’t done what you thought it would do based on the information presented to you at that time you can go back and re-assess your decision and compare it to todays data sheet and see where the shifts are.
I’m only using Rolls Royce as an example for the blog because it’s an international brand but looking at this information I wish I bought RR last year. LOL. At point 1 you can see what the share price was 12 months ago; at point 2 the stock rank Stockopedia gave it and at point 3 the line graph of the previous 12 months. You may have decided looking at the line graph that RR was on the turn, it had bottomed out and looking at the line graph today you’d have been right. What I need to do is look at my stock screens and find out why RR didn’t pop up.
The Stockopedia Learn section
Finally, the last thing I want to talk about in this Blog is the Learn section. Clicking on the Learn button opens up an Aladdins cave of articles and videos for you do devour at your hearts content.
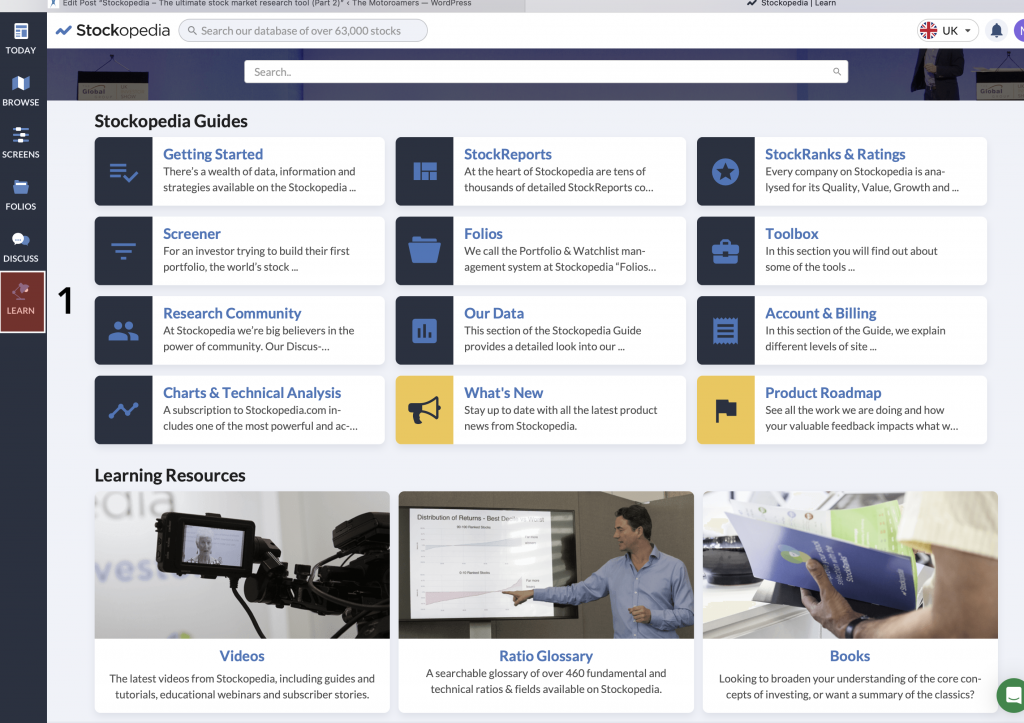
As you can see from the picture, It’s all there. All the information you need to use Stockopedia to its’ full potential and become a stock market investor and relatively speaking free of charge. If you’ve read the blogs from the start you know that there is a life beyond active work, you can improve your money management and de-clutter to turn ‘stuff’ into cash, open an online broker account, choose an investing strategy, create a stock screen, do some research, start buying shares and build an investment portfolio. But wait a minute, the key to profitable gains in the stock market relies on understanding fundamentally what you are. Are you a trader or an investor? In the next blog I’ll discuss 3 reasons why you should start investing today.
Following this with extreme interest. Needing to secure my financial position with an income before travelling full-time. This had made it doable. So going to start small and hopefully build up my confidence. Lots of research to come and your blogs have really helped. Looking forward to more of your information and experience and own research before taking the plunge
Hi Stephen, glad to hear. I’m currently working on a video series too over on YouTube so hopefully that will help. If you have any questions don’t hesitate.